Plan for CAPS real time forecast support for IHOP
For further information, contact
CAPS has received a 3-year NSF grant to participate in IHOP, with a focus on the optimal utilization and impact of water vapor and other high resolution observations in storm-scale QPF. Particular emphasis will be given to the sensitivity of storm-scale QPF to initial conditions near the time of convective initiation, and to boundary conditions as well. Initial conditions for the storm-resolving ARPS will be obtained using 3DVAR schemes, and sensitivity will be studied using adjoint as well as traditional forward sensitivity methods. The estimation of background error covariances, via ensemble techniques applied at the meso- and storm scales, is another important component of the research. The study will take advantage of data collected during IHOP for both model initialization and verification, and also will examine the impact of routine and special data sets on forecast quality. The project summary can be found at http://twister.ou.edu/IHOPAbstract.html.
To support the real time operations of IHOP, and to establish data sets for extensive post-field program analysis, CAPS will run its Advanced Regional Prediction System (ARPS) daily, at a variety of resolutions, during the entire field campaign. The real-time data also will be made available to the UCAR Joint Office of Science Support (JOSS) for field experiment archives.
A Pentium-IV cluster supercomputer with 256 of the latest-generation processors,
and a powerful SMP with 32 processors, will be available at the
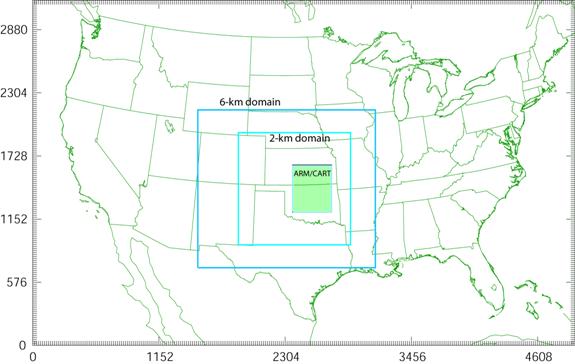
Fig 3. The 18, 6 and 2 km resolution ARPS model grids to be run by CAPS during IHOP. The 2 km grid covers areas that climatologically favor convective initiation and MCS events, and also encompasses the ARM-CART region (shown in green).
Forecast products will be posted on the web in a manner similar to the current
real-time ARPS forecasts (c.f. http://www.caps.ou.edu/wx). Special graphics
products, focused on moisture, can be added to the graphics suite. It is anticipated
that the
Fig. 4. Timeline of proposed CAPS forecast at three resolutions.
18-km grid: 1 hour data collection, 10 minute analysis, 90 minute forecast. Thus, the entire 48h forecast will be completed at 1440 UTC. Graphics will be generated as the model output is written to disk, therefore the web posting will be completed a few minutes after the forecast ends. This grid will use a 6-hour ETA forecast as analysis background, all available rawinsonde, profiler, standard surface observations and Oklahoma Mesonet data, and both visible and IR satellite data.
6-km grid: Analysis will be performed at 1315 UTC and completed by 1335 UTC; thus, this grid is spawned as the 18-km grid forecast is being completed, with the boundary conditions for this run coming from the 18-km forecast. Forecast begins at 1345 UTC and is completed by 1545 UTC. Preprocessing of Level-II radar data begins as soon as the data arrive, which typically happens within a minute after each radar volume, and a few minutes after data collection time for Level-III (NIDS).
2-km grid: This
model run will start from a 15 UTC analysis, using the 3-hour 6-km forecast
as the background. The 6-km forecast will provide the boundary conditions.
The 2-km run will again incorporate Level-II and Level-III (NIDS) radar data.
Attempts will be made to perform single-Doppler velocity retrievals on Level-II
data from
2-km grid (convection present): The proposed forecast, contingent upon available computer resources, will start from a 00 UTC analysis, using the 9-hour 6-km forecast as the background. The 6-km forecast will provide the boundary conditions. The 2-km run will include Level-II and Level-III (NIDS) radar data as in the 15 UTC run. More serious attempts will be made to perform single-Doppler velocity and thermodynamic retrievals using Level-II radar data and analyze the retrieved quantities into the 2-km initial condition. We expect this run to be completed by 06 UTC.